New Data Show Economic Impact of COVID-19 on Arts & Culture Sector

Washington, DC— New data released today by the National Endowment for the Arts (NEA) and the Bureau of Economic Analysis (BEA) provide insights into the impact on the arts and cultural sector by COVID-19. The Arts and Cultural Production Satellite Account (ACPSA) tracks the annual economic impact of arts and cultural production from 35 industries, both commercial and nonprofit. These data describe the national and state-level contributions of the arts and cultural sector to the nation’s gross domestic product (GDP) in 2020, the first year of the pandemic.
“While arts and cultural industries and workers nationwide have sustained heavy losses, the sector continues to play an outsized role in the U.S. economy—as the new data demonstrate,” said NEA Chair Dr. Maria Rosario Jackson. “The NEA is committed to participating as a key partner in the recovery of this sector, recognizing not only its economic value, but also the arts’ capacity to transform the lives of individuals and communities in other ways, contributing to health and well-being, and overall resilience.”
National-level ACPSA data
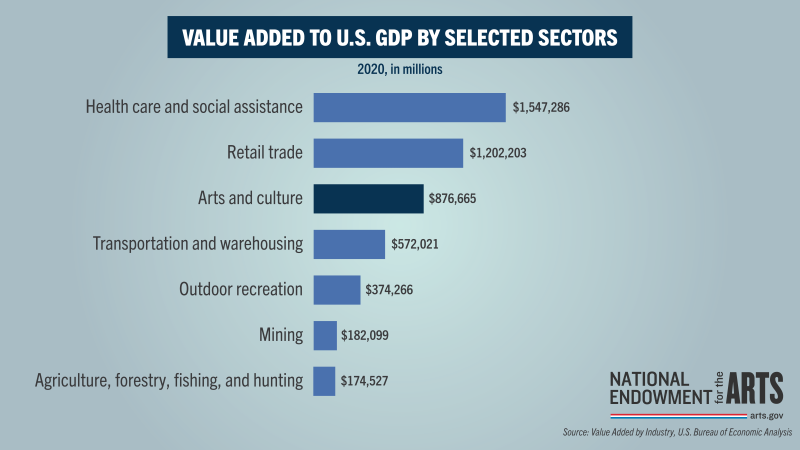
In 2020, arts and culture added $876.7 billion, or 4.2 percent, to national GDP. Between 2019 and 2020, the U.S. arts economy shrank at nearly twice the rate of the economy as a whole: arts and cultural production fell by 6.4 percent when adjusted for inflation, compared with a 3.4 decline in the overall economy. While the size and diversity of the arts and culture sector helped it to remain a major contributor to the economy, certain arts industries saw enormous declines.
In year one of the COVID-19 pandemic, few areas of the U.S. economy were harder hit than the performing arts:
- Performing arts presenters and performing arts companies joined oil drilling/exploration and air transportation as the steepest-declining areas of the U.S. economy in 2020.
- After adjusting for inflation, the value added by performing arts presenters (including festivals) fell by nearly 73 percent between 2019 and 2020.
Other arts and cultural industries also saw steep declines in economic activity between 2019 and 2020:
- The value added from new construction of arts and cultural facilities declined by 24.3 percent; museums by 22.0 percent; independent artists/writers/performers by 20.6 percent; and motion picture and video production industries by 17.9 percent.
(Note: “Independent artists/writers/performers”—a single industry—includes the self-employed and those working as independent contractors. Within the ACPSA, earnings from these workers are captured as gross output and value added. Yet, as workers, they are excluded from ACPSA employment data.)
However, several large industries helped to cushion declines for the overall arts sector:
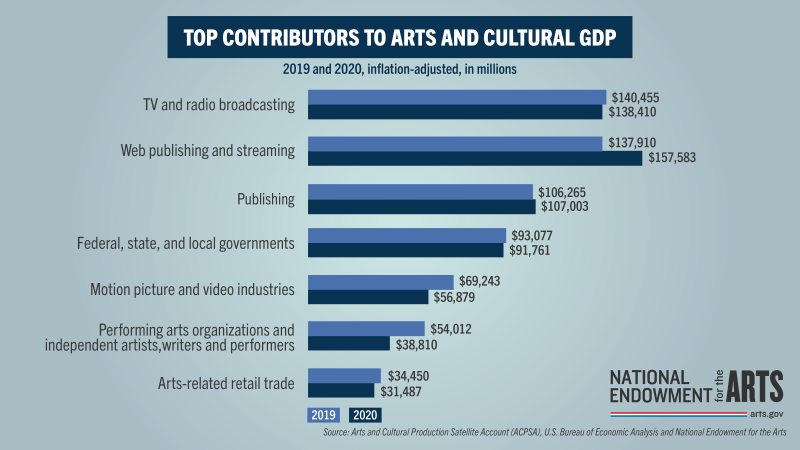
- Between 2019 and 2020, the value added by web publishing and streaming—already a growth industry—leapt by 14.3 percent. Employment in this industry grew by 12,000 salaried workers.
- Government’s arts and cultural contributions—both in terms of employment and in value added to GDP—remained fairly stable between 2019 and 2020. Examples of arts and cultural goods and services provided by government include arts education in public schools; museums and nature parks; and federal, state, and local arts funding.
- In addition, the economic contributions of TV and radio broadcasting fell by only 1.5 percent; and value added by publishing industries changed very little between 2019 and 2020.
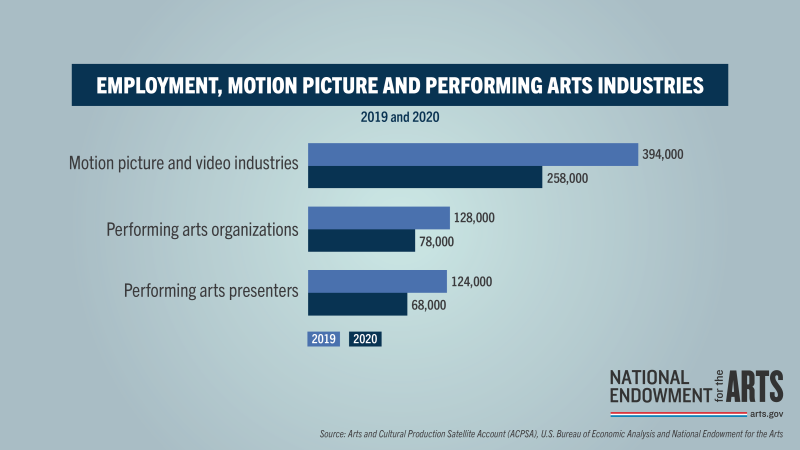
The ACPSA also helps to quantify the impact of COVID-19 on employment in the arts and cultural industries. Between 2019 and 2020, the arts economy shed more than half a million jobs (604,000 workers)—not counting self-employed artists and other cultural workers.
- 40 percent of the decline in arts and cultural employment (salaried workers only) occurred in three industries: motion picture and video production; performing arts presenting; and performing arts companies.
- Motion picture and video production lost the greatest number of workers in 2020—136,000.
- Employment by performing arts presenters and performing arts companies fell by 56,000 and 50,000 workers, respectively.
As noted above, ACPSA employment data exclude self-employed workers. Yet artists are far more likely than other workers to be self-employed.
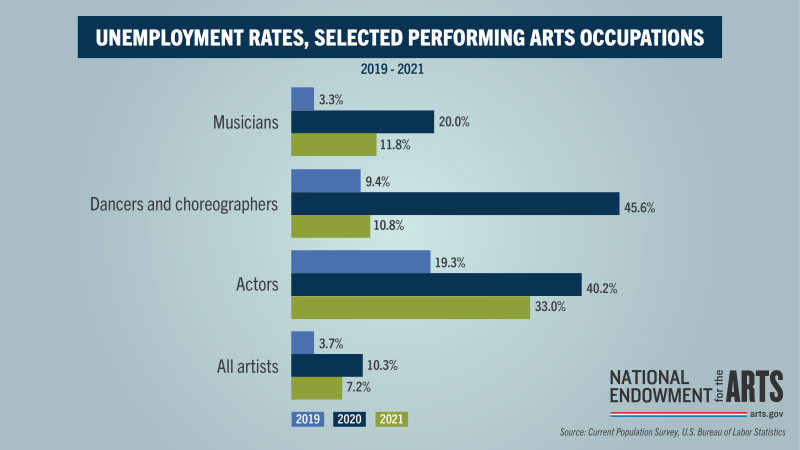
Examining data sources apart from the ACPSA suggests that while arts and cultural industries regained some ground during 2021, they have not risen back to 2019 levels.
- The overall unemployment rate for artists in 2021 was 7.2 percent, down from 10.3 percent in 2020, but still greater than in 2019, when the rate was 3.7 percent.
- The revenue earned by performing arts companies in the third quarter of 2020 doubled in the same quarter of 2021, from $834 million to $1.7 billion. Yet that amount remained far below 2019's third quarter, when performing arts companies earned $12.7 billion.
A national summary report from the National Endowment for the Arts, and an interactive graphic showing the data above, are available as an Arts Data Profile on arts.gov.
State-level ACPSA data
Today’s announcement also includes information on the value-added by arts and cultural industries to states’ economies. In addition to a brief report, the NEA provides an interactive map that shows state-level estimates of arts and cultural value added, employment, and compensation figures derived from the Arts and Cultural Production Satellite Account (ACPSA). Both are available in the state Arts Data Profile on arts.gov.
For additional state-level resources, BEA has produced ACPSA fact-sheets for each state and, in partnership with the NEA, the National Assembly of State Arts Agencies has created an interactive dashboard by state.
The National Endowment for the Arts, through funding provided by the CARES Act and the American Rescue Plan, is helping to support the recovery of the arts and culture sector by making direct grant awards; by enlisting partners at the regional, state, and local levels to distribute funding; and by staying abreast of key issues impacting the field as well as insights about new ways of working. For more information, visit arts.gov. Information about the NEA’s current grant opportunities as well as resources for new and returning applicants is available in the Grants section of the website.
About the National Endowment for the Arts
Established by Congress in 1965, the National Endowment for the Arts is the independent federal agency whose funding and support gives Americans the opportunity to participate in the arts, exercise their imaginations, and develop their creative capacities. Through partnerships with state arts agencies, local leaders, other federal agencies, and the philanthropic sector, the Arts Endowment supports arts learning, affirms and celebrates America’s rich and diverse cultural heritage, and extends its work to promote equal access to the arts in every community across America. Visit arts.gov to learn more. Visit arts.gov to learn more.
Contact
Liz Auclair, auclaire@arts.gov, 202-682-5744


