Taking Note: Getting Creative about Definitions (and Research Needs) of Artists

By Sunil Iyengar, NEA Director of Research & Analysis
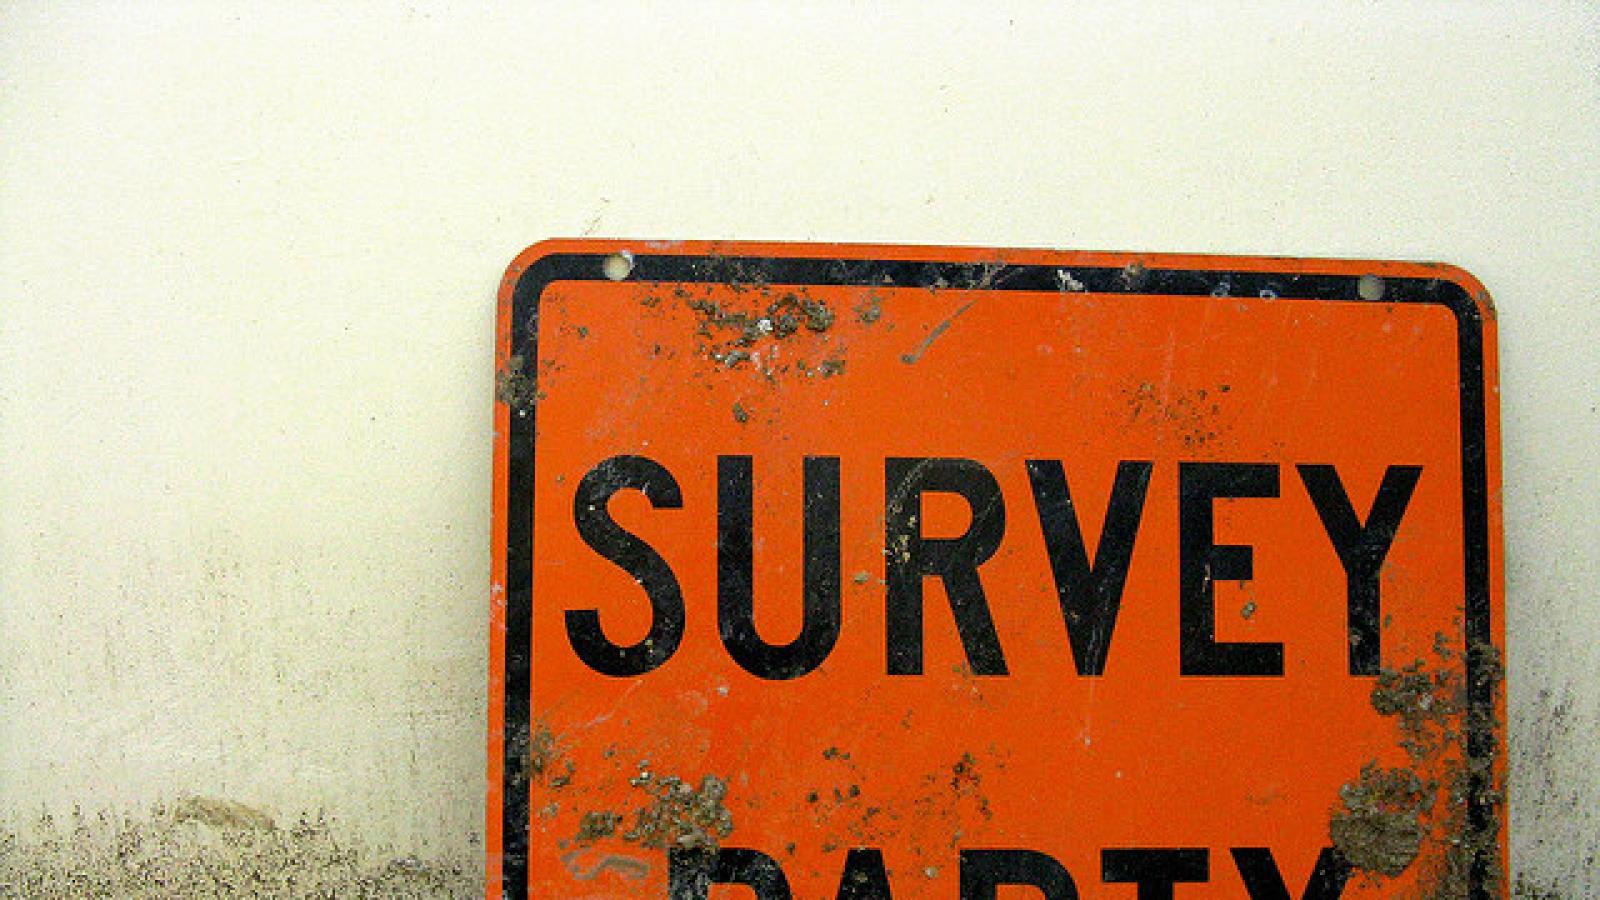
Construction sign that says "survey party"
Survey party sign by flickr user m kasahara
When collecting and reporting stats about the arts or about anything else, it’s frequently necessary to run what researchers call a “validity check.” There are many ways of doing this. First, one hopes that the survey instrument—the questions being asked—and the sampling strategy itself have been piloted and any kinks removed before data collection begins. Then, once the data pour in, they must be cleaned and weighted if the goal is to extrapolate results to a larger group. But validation also occurs after the findings have hit the street. When the NEA’s research office reports data on how Americans participate in the arts, for example, we’re accustomed to one of four possible reactions from arts funders or practitioners (who are by no means the only “users” of the data):
  1. “Yes, that’s exactly what I’m seeing out there; now we have to pull together to combat (or sustain) this trend.”
  2. “That’s not what I’m seeing at all.”
  3. Duh! Did we need a survey to know that?”
  4. “Okay. I’m prepared to believe those are the results, given the questions you asked. But how about asking these questions instead?”
All of these observations have value (yes, even #3), but #4 can lead to innovations in measurement. Let’s face it: surveys are inherently conservative. To provide for long-term trend reporting, researchers working with a trusty instrument hate to tamper with the flow and content of core questions, though they may be enticed to add questions or a separate module entirely. But there are unique curbs on a general-population survey—especially a federal survey. They include time (keep it short, avoid survey fatigue) and diction (keep it simple, be understood by everyone), among other considerations. Despite these challenges, we’ve made some significant progress on updating the NEA’s Survey of Public Participation in the Arts (SPPA) over the past few years. The next version, to be fielded in 2017, will collect baseline information on a host of variables we previously have not explored. Two topics, among many, will afford us more data from that survey: motives and venues for artistic expression. So much for validating constructs in arts-participation research. What about research on artists? Here the circumstances are different, at least where NEA research is concerned. Unlike the SPPA—for which our researchers actually write the questions—our studies of artists’ numbers, their employment and income patterns, and their demographic and geographic characteristics, rely on data already collected about the U.S. workforce. The data come from the U.S. Census Bureau. This background knowledge is useful when reading Creativity Connects, a report that the Center for Cultural Innovation (CCI) recently wrote for the NEA. Early on, the report credits the federal definitions that operate in NEA studies of artists. When using the American Community Survey datasets, for instance, one is forced to count people as artists only if the greatest number of hours they worked, in a given week, falls into a few discrete occupation types. But what if the artist already holds two non-artist jobs from Monday through Friday, and is making ends meet by also working as an artist on the weekends? What if a person considers himself or herself an artist, but is not earning as one? All told, according to CCI, “although federal statistics can produce reliable counts of U.S. artists by a standard definition, there is a commonly held belief…that the current categories are inadequate.” Beyond definitional issues concerning time on the job or sources of income, “evolving norms” for artists suggest that “official categories and designations may lag in capturing” contemporary artistic practice, CCI writes. In particular, the report claims that artists work increasingly across multiple disciplines and settings. Although federal data can be used to ascertain which industries employ artists, there remain gaps in knowledge about how self-employed artists weave in and out of industries and sectors, in what venues artists work, and how they supplement incomes. The CCI report was not undertaken to evaluate research taxonomies and data sources for reporting about artists, so other researchers and organizations must weigh the importance of filling those gaps, and propose feasible solutions. NEA-funded research addresses many diverse factors affecting artist careers. It does so through past, ongoing, and planned projects, examples of which are:
  • Reporting detailed geographic estimates, where possible (see NEA Arts Data Profile #1), to supplement the NEA’s periodic statistical reports about U.S. artists.
  • Reporting estimates and characteristics of workers who moonlight as artists (see NEA Arts Data Profile #3), and those who work in the field of industrial design (see this report), and workers for arts and cultural industries as a whole (see here).
  • Supporting a study investigating the relationship between undergraduates' arts or non-arts training and the development of workforce skills such as creative problem-solving and entrepreneurship. (This report’s just out!)
  • Supporting a study of artists' employment patterns relative to prior decades, how artists found new markets during and after the recent recession, and how they use crowdfunding sites in the “gig” economy. (Joanna Woronkowicz at Indiana University-Purdue University Indianapolis shares some of her insights here, though the study is still in progress.)
  • Supporting a mixed-methods study to collect and analyze data from U.S.-based musical artists, for the purpose of understanding how revenue streams for musicians and composers have changed over time, relative to genre, state of the artists’ careers, and artist locations. (The study is still in progress.)
  • Planning an omnibus report on artists and other cultural workers, drawing from multiple data sources, to examine variables including degrees earned by artists, industries employing artists, employment projections for artists, and new hires and job flow. (The report will come out in 2017.)
Despite this ever-growing portfolio, there remains ample scope for public dialogue about standard data needs that would help us to better monitor “trends and conditions affecting U.S. artists”—the subtitle of the CCI report. The authors skilfully interpret findings from myriad sources: interviews, regional roundtable discussions, and literature, and at least one “field expert” convening. The result is a brisk assessment of the current state of artist support systems. CCI documents changes wrought by technology, by socio-economic forces at large, and by historic disparities between demographic subgroups. The report also diagnoses a gap between, on the one hand, the training and funding mechanisms for artists, and, on the other, the actual milieus in which many artists are bound to thrive. To top it off, the report features several essays that originated as blog posts for the website Creativz.us. And an interactive graphic—released with the report—presents real-world examples of artists connecting with other disciplines, industries, and sectors.   Thanks to this report, we know a lot more about artist resource needs. But now, by continuing to validate federal statistics about artists—through efforts such as Creativity Connects—we hope to identify and solve problems around artist data needs.