Background
Dataset
Arts and Cultural Production Satellite Account (ACPSA).
Periodicity
Launched in 2013, the ACPSA is intended as an annual product.
Source/Sponsor
Partnership between the NEA’s Office of Research & Analysis and the U.S. Bureau of Economic Analysis.
Research Topic
Arts employment and compensation.
Notable Features
State-level estimates of arts and cultural employment and compensation by industry;
Location quotients (i.e., a state’s concentration of arts and cultural employment or compensation indexed to the overall U.S. share of 1.0);
Full time-series spanning state data from 2001 to 2014.
Revisions to ACPSA
This ACPSA release is the first to provide, by industry, state-level estimates of arts and cultural employment and compensation. The next iteration, planned for release in early 2018, will include state-level estimates of arts and cultural “value added,” a.k.a., ACPSA gross state product (GSP).
Overview
The ACPSA shows that in addition to New York and California, states such as Wyoming, Washington, and Utah are home to relatively large concentrations of arts and cultural workers. Wyoming’s high rank is due in part to the comparatively large number of workers employed by national parks (which are included in the ACPSA as natural heritage), while Washington’s score is led by arts-related software publishing and retail sales.
Utah’s high concentration of arts and cultural employment is influence by several industries, including arts-related construction, the design and manufacture of jewelry, and performing arts presenters.
By industry, a number of states stand out in concentration of arts workers.
In Nevada, for example, the share of workers employed by the state’s performing arts companies, relative to all workers in Nevada, is more than twice that of the national share. And Michigan is home to the greatest concentration of workers in industrial design services.
Employment in Louisiana’s motion picture industry, as a share of all workers in the state, is 45 percent greater than the national concentration of workers in that industry.
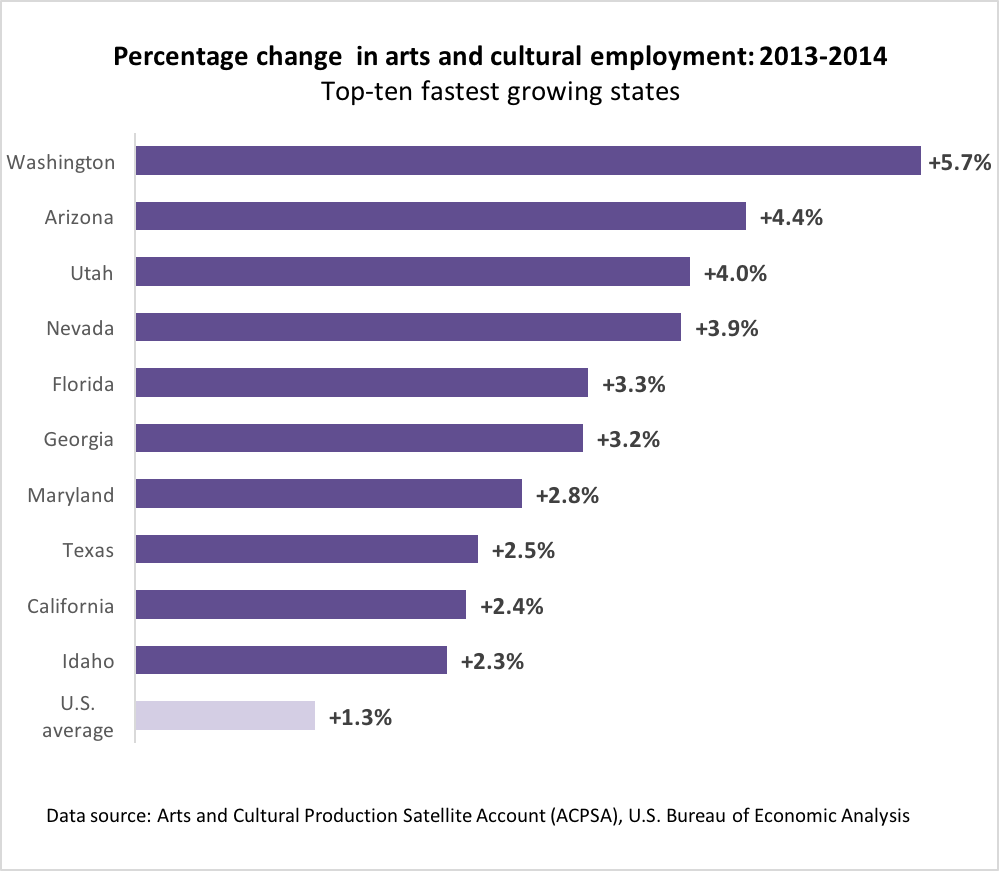
Because the ACPSA includes a full time-series of estimates, it shows which states are growing faster than average in arts and cultural employment. Between 2013 and 2014, for example, Florida, Georgia, Maryland, and Texas witnessed ACPSA employment growth of around 3 percent—a rate well above the overall U.S. rate of 1.3 percent during that period.