Why it is Difficult to Rank State Levels of Arts Participation
For each estimate provided in the tables in this Arts Data Profile, there is an associated standard error of the estimate which translates into lower and upper-boundary confidence intervals. These boundaries indicate the range of the estimate after considering the sample designs of the Survey of Public Participation in the Arts (SPPA) and the Arts Basic Survey (ABS).
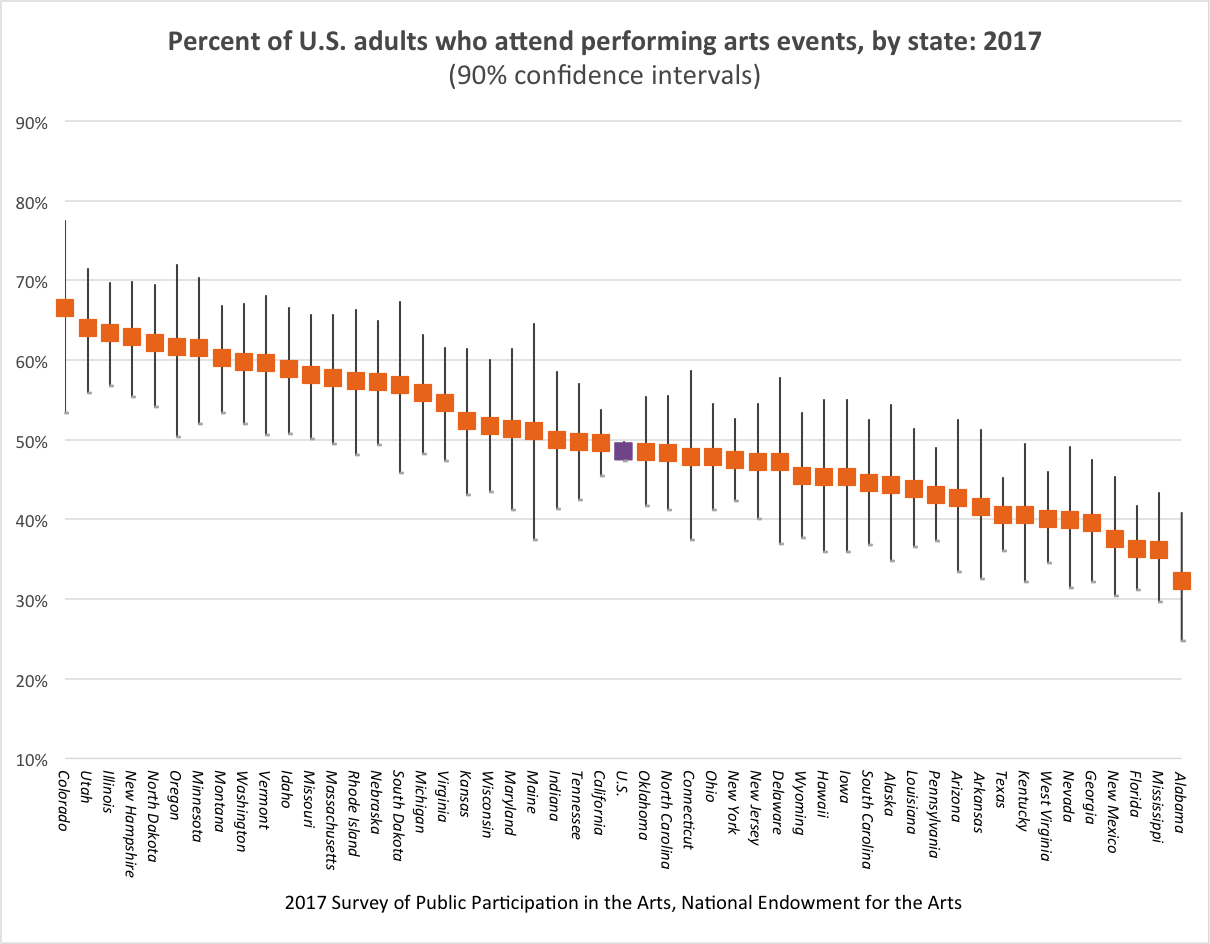
For example, the 2017 performing arts attendance rate for Pennsylvania is 43.0 percent, a rate greater than the figure reported for Texas, which is 40.5 percent. However, the confidence interval for Pennsylvania’s performing arts attendance rate ranges from a high of 48.9 percent to a low of 37.3 percent. This interval crosses the range estimated for Texas, which spans 36.1 percent to 45.2 percent.
Because the intervals for the two states overlap, we cannot necessarily conclude that Pennsylvania’s performing arts attendance rate is significantly greater than the rate for Texas.
The graph below shows that the confidence intervals associated with performing arts attendance overlap among many states. In the following states, however, performing arts attendance is significantly greater than the U.S. rate: Colorado; Utah; Illinois; New Hampshire; North Dakota; Oregon; Minnesota; Montana; Washington; Vermont; Idaho; and Missouri.
Conversely, attendance is below average in: Alabama; Florida; Mississippi; Texas; and West Virginia.
Calculating Confidence Intervals for SPPA Estimates
As a supplement to the Current Population Survey, the SPPA and ABS are complex surveys that employ stratification, weighting, and "clustering,” a sampling technique in which the population is divided into groups, or clusters; a sample of these groups is selected.
The 90 percent confidence intervals reported in this Arts Data Profile were generated by adding (upper limit) or subtracting (lower limit) 1.645 times the estimated standard errors. The standard errors, in turn, were estimated using a balanced repeated replication (brr) method, which incorporated the replication weights that accompany the SPPA and the AABS. Further, the brr method applied a "Fay" adjustment of 0.50 percent.1
1 For additional information, see Cornell University, Cornell Statistical Consulting Unit, “Overlapping Confidence Intervals and Statistical Significance,” Stata News #73, October 2008.