Background
Dataset
U.S. Arts and Cultural Production Satellite Account (ACPSA) — state-level estimates
Periodicity
Launched in 2013, the ACPSA is intended as an annual product. Complete state estimates, corresponding with the national account, became available in 2018.
Source/Sponsor
Partnership between the National Endowment for the Arts’ Office of Research & Analysis and the U.S. Bureau of Economic Analysis.
Research Topic
Arts economies, employment, and compensation.
Notable Features
State-level estimates of arts and cultural value-added, employment, and compensation by industry;
Location quotients (i.e., a state’s concentration of arts and cultural value-added, employment, or compensation indexed to the overall U.S. share of 1.0);
Full time-series spanning state data from 2001 to 2017.
Comprehensive Updates
This wave of the ACPSA reflects comprehensive revisions or “benchmark” updates to the Bureau of Economic Analysis’ national income and product accounts. Consequently, revisions were made to the full time-series of the ACPSA dataset, beginning, at the state level, in 2001 and ending in 2017.
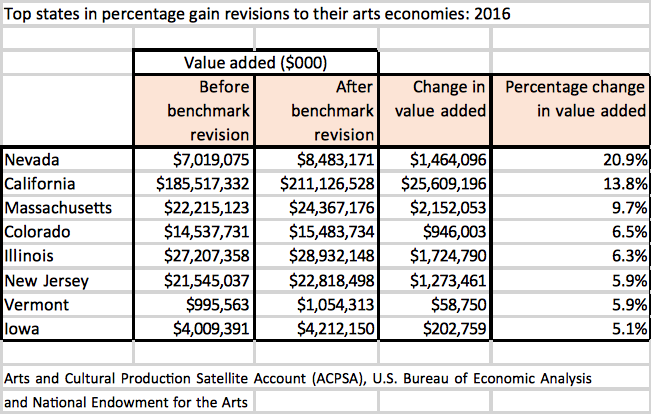
The comprehensive revisions show that the arts economy was larger than previously thought. Following the benchmark update, arts and cultural “value added” in 2016 was $839.6 billion—an amount $35.4 billion greater than the pre-revision 2016 estimate of $804.2 billion.
States gaining the greatest amount vis-à-vis comprehensive revisions included Nevada, California, Massachusetts, and Iowa. Benchmark revisions added $25.6 billion to California’s arts economy; $2.2 billion was added to the Massachusetts arts economy.
For many states, revised additions stemmed largely from web broadcasting and streaming, which accounted for much of the upward revision to the national tally of arts and cultural production.
Benchmark revisions to web broadcasting and streaming added $32 billion to California’s arts economy; it added $79 million to Iowa’s.
Overview
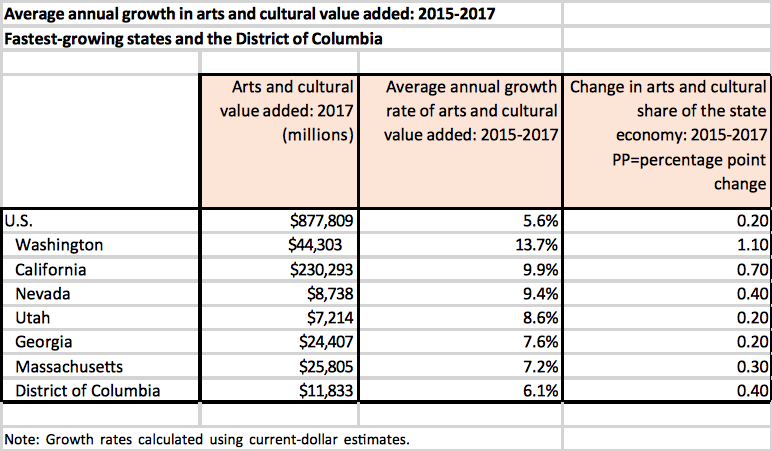
Between 2015 and 2017, the value added by arts and culture to the nation’s economy (not adjusting for inflation) grew at an average annual rate of 5.6 percent. But in five states, the average annual growth rate was 7.2 percent or greater; in the District of Columbia, growth was 6.1 percent.
Arts-related retail trade contributed considerably to the growth in Washington’s arts economy, while web publishing and streaming added to California’s arts production.
Georgia witnessed growth in its motion picture and video industries; Utah gained in value added by the state’s performing arts companies.
Economic value from the construction of new arts and cultural structures spiked in Massachusetts between 2015 and 2017.