The U.S. Arts and Cultural Production Satellite Account: 1998-2013
Title of Dataset
Arts and Cultural Production Satellite Account (ACPSA)
Periodicity
First reported as preliminary data in 2013, the ACPSA is intended as an annual product. The next iteration, planned for release in late 2016, will include state and/or regional estimates of arts and cultural employment and compensation.
Source/Sponsor
Partnership between the NEA’s Office of Research & Analysis and the U.S. Bureau of Economic Analysis
Research Topic
Arts and the GDP
Notable Features
- Inflation-adjusted estimates of the arts and culture’s real contribution to the U.S. economy
- Value added
- Gross output
- Full time-series spanning 1998-2013
- Employment and compensation by arts and cultural industries
- Supply and consumption of arts and cultural goods and services, including imports and exports
- Gross output price indexes for arts and cultural commodities
Revisions to the ACPSA
This ACPSA release is the first to provide estimates controlled for inflation. The account provides both nominal and “real” estimates of arts and cultural production measured in chained 2009 dollars.
Overview
Over the 1998-2013 timeframe, the average annual growth rate in the real value added by arts and cultural production was 1.8 percent, comparable to the 1.9 percent growth rate generated by the total U.S. economy during that period.
Moreover, between 1998 and 2013, real (i.e., inflation-adjusted) value added by arts and cultural production grew by $165 billion, or 32.5 percent.
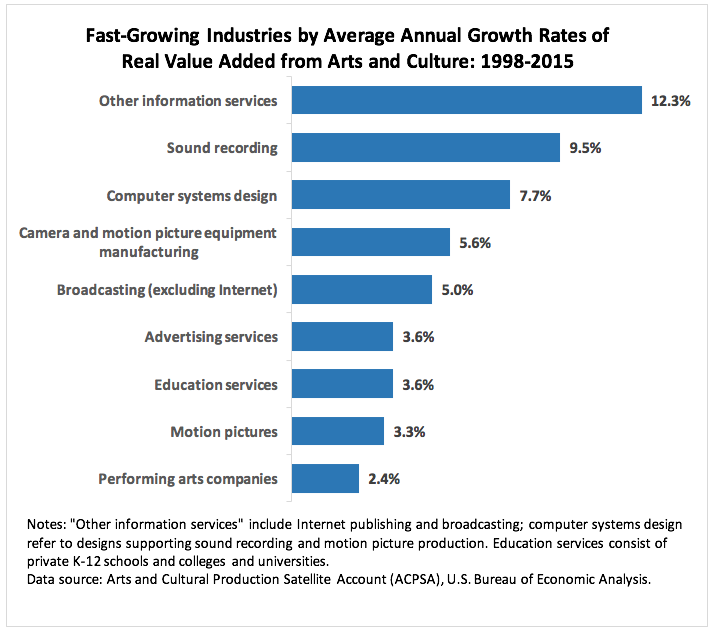
Fast-growing industries producing arts and cultural services include: “other information services,” an industry that includes online publishing and broadcasting; sound recording; arts-related computer systems design (which support sound recording and motion picture production); and performing arts companies.