Taking Note: Expanding Horizons at an Arts Access Datathon

Arts Data: Reasonably Well-Structured Chaos
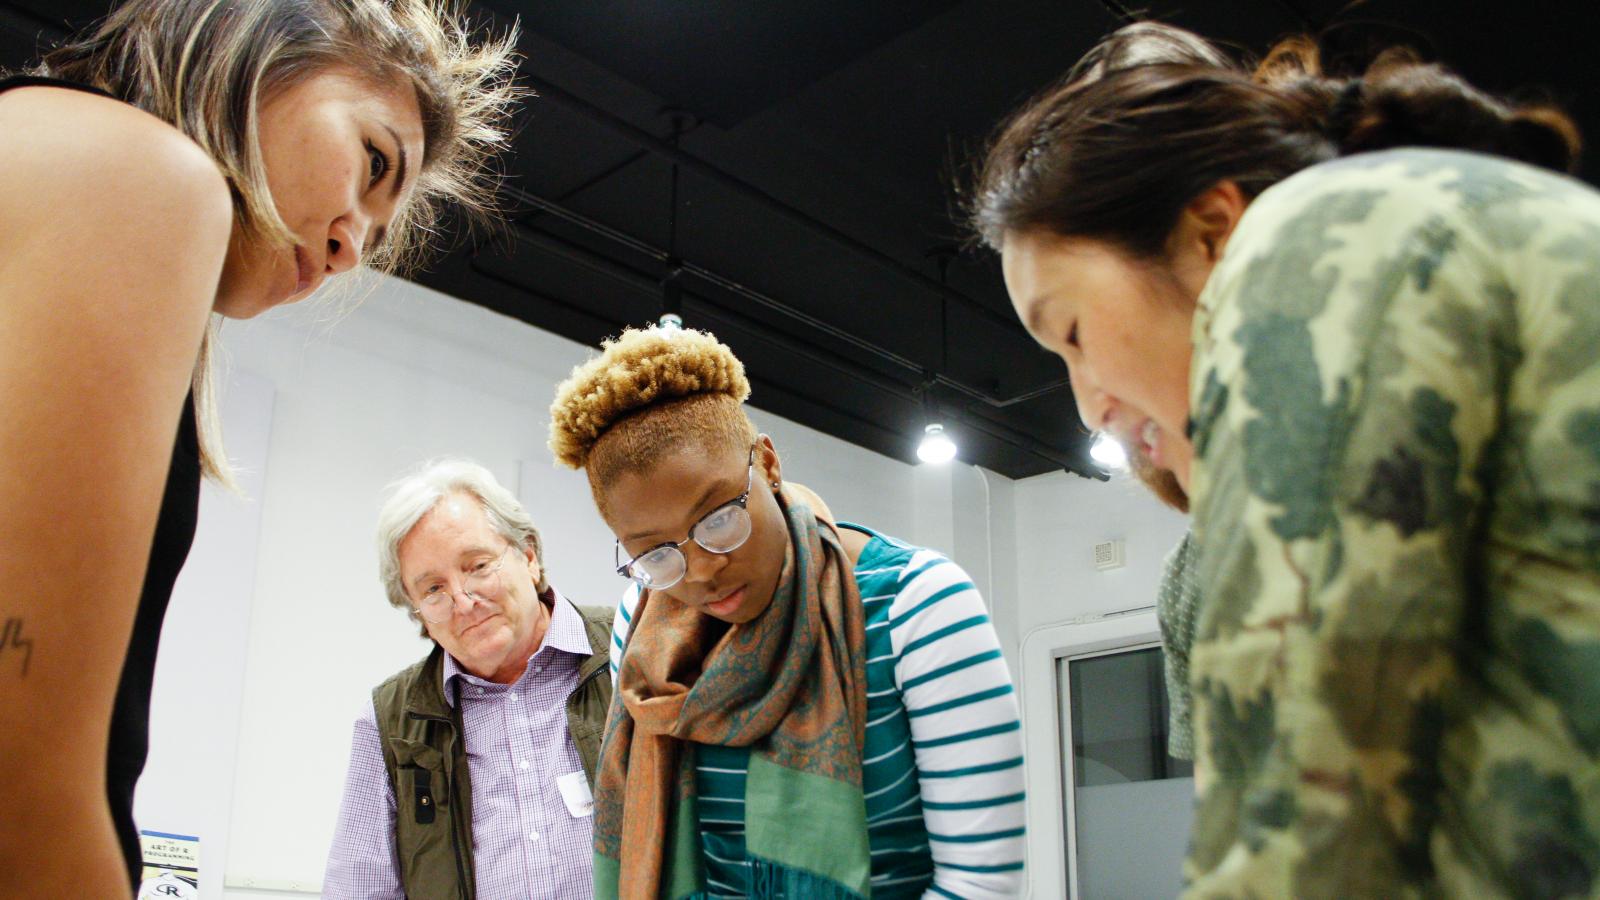
What happens when you put more than a hundred people together in a room—artists, arts administrators, arts educators, and hackers—to spend an entire day exploring arts data? Reasonably well-structured chaos.
Earlier this year, the LA County Arts Commission, in partnership with the City of LA’s Department of Cultural Affairs, did just that at the Arts Access Datathon. It was the culmination of nearly a year of intense planning. Its origins, however, date back more than four years to when I joined the LA County Arts Commission as their first research and evaluation staff. New colleagues both inside the agency and across the arts ecology often talked to me about how unsophisticated or behind-the-times the arts are in terms of data.
I soon realized that wasn’t quite true. I came to the arts having spent my career doing applied research and evaluation for nonprofits, philanthropies, and government. I also write fiction, which had been my main window into the arts sector. Over a career in workforce development, child development, and social justice, I’d learned that collecting good data is difficult in every field. Putting rigorous social science methods to work in an environment where you’re serving the public is hard work. Every sector struggles to collect data consistently, and to come up with meaningful measurements of success. Jurisdictional differences and idiosyncrasies in programming prevent us from developing common data standards. Most of the data challenges I’ve discovered in the arts are ones I’ve seen in other fields.
When arts administrators apologized for the poor quality of their data, what I heard was a desire to get better at collecting, understanding, and using information. This tradition of seeking excellence is intrinsic to the arts, and one I saw as an opportunity. What’s more, I was discovering how much data we have, from collections data managed by public arts agencies, to organizational data collected through grant reporting, to audience data used by performing arts organizations. Significant and often longstanding arts datasets are managed by DataArts, the National Endowment for the Arts, state education agencies, and others. I began talking with colleagues about holding a public event where our arts community could explore the data we have and expand our horizons for how we could use it.
By 2016, the LA County Arts Commission was in the midst of a countywide Cultural Equity and Inclusion Initiative that was developing a series of recommendations to the LA County Board of Supervisors. The research and evaluation team had completed a literature review and we were about to launch the first survey to learn the demographics of our local arts workforce demographics. We decided to make improving access to the arts the focus of our datathon, especially for underserved communities.
How the Datathon Worked
The Arts Access Datathon was different from a traditional hackathon, where participants bring skills with data or writing code and the goal is to prototype some kind of app. We encouraged artists, arts administrators, and arts educators to participate in our datathon, and didn’t assume data skills. We also recruited from the civic hacker community. We sorted participants in advance into 11 separate groups, based on skills they reported when they registered.
On the datathon website we compiled a wide range of datasets and data tools, along with descriptive information to help people understand how they could be used. I created a zine that explains how spreadsheets are simply another way of telling a story.
The morning of the datathon, an artist led a series of exercises to help participants get to know each other, and a sound artist closed out the day with a site-specific installation that incorporated some of our datasets. Throughout the day, a series of presenters shared information about arts datasets as well as tools for analyzing and visualizing data. Sunil Iyengar, director of the Office of Research and Analysis at the NEA, inspired participants with a keynote address. Then we set the groups free to develop proposals. At the end of the day, each group presented their idea for how to use data to improve access to the arts. A panel of judges scored the presentations and prizes were awarded to the top three.
What We Learned
Perhaps my favorite moment at the datathon happened while one of my staff, Dr. Susannah Laramee Kidd, was demonstrating Microsoft Excel basics. She showed a few calculations, as well as how to make a simple pie chart. When she demonstrated how to make a pivot table, the woman standing beside me gasped aloud.
“What program is she using?” she asked with wonder in her voice.
“Excel,” I said.
“I had no idea you could do that. I’m going to open Excel when I get home.”
Some of the best tools out there are at our fingertips. Arts administrators collect all kinds of data that, with a bit of guidance, could be mined for programmatic insights. We have grant and contract reporting guidelines that could be tweaked to generate more useful data. Common questions in different programs would allow us to aggregate data to tell a story across the organization. We don’t always need to create lengthy surveys, but can instead ask a few well-written questions at the right time, and collect responses systematically. And we should share everything: data, methods, and findings. That’s a big part of what the datathon was about.
There will always be a place for advanced statistics, methodologically sophisticated studies, or slick new software packages. But much of what we need in the arts is not so distant.
Later this summer, we will be publishing a fuller report on the datathon and a toolkit to help other agencies conduct their own. Look for it at artsdatathon.org.
Bronwyn Mauldin is director of Research and Evaluation at the LA County Arts Commission. She also teaches research methods to graduate students in the arts administration program at Sotheby's Institute of Art at Claremont Graduate University.


