Taking Note: Performing Arts Presenters Continue to Spur Economic Growth
By Bonnie Nichols, Office of Research & Analysis, National Endowment for the Arts
Some recent news stories have captured the economic draw of the performing arts—going so far as to compare the sector favorably with sports. For instance, a November 19 headline in The Wall Street Journal proclaims: “Concerts Are New Arenas’ Main Attraction, Rather Than Sports.” In the accompanying piece, writer Anne Steele has the Oak View Group (a Los Angeles-based entertainment and sports-facilities company) observe that an arena can generate twice as much net income from hosting a concert as from a national basketball or hockey game. Oak View plans to develop eight new arenas over the next few years; six will forego major-league games to make room for music concerts.
The economic footprint of performing arts presenting is tracked by the Arts and Cultural Production Satellite Account (ACPSA), produced by the Bureau of Economic Analysis in partnership with the National Endowment for the Arts. Here’s a preview of data that will be released early next year. In 2017, U.S. performing arts presenters added $15 billion to the U.S. economy. That same year, the industry employed 112,000 workers.
Moreover, the performing arts presenting industry is growing faster than the overall arts economy or, for that matter, the U.S. economy at large. Between 1999 and 2017, average annual growth in real/inflation-adjusted value added by performing arts presenters was 4.7 percent. By comparison, ACPSA value added grew by 2.5 percent and U.S. GDP rose by 2 percent.
(What exactly is “value added”? The term refers to the amount an industry contributes to GDP. It’s equal to an industry’s gross output minus things like material and energy costs. For example, a dance company’s gross output includes the cost of pointe shoes and the electricity needed to run the operation. But the company’s value added excludes these costs.)
Also, the Bureau of Economic Analysis reports that consumers spend more on admissions to the performing arts ($32.8 billion in 2017) than they do on tickets to sporting events ($26.1 billion).
And where do performing arts presenters have the greatest economic impact? In Nevada.
A location quotient (LQ) is a measure of an industry’s state concentration of value‐added relative to the U.S. industry’s share. An LQ of 1.0 means that the state and the nation are equally specialized in the industry in question. Nevada’s performing arts LQ was almost 11 in 2016, indicating a very strong concentration—11 times greater than the concentration of the performing arts in the U.S. economy.
Performing arts presenting was also concentrated in the District of Columbia, New York, Ohio, and Georgia. Contributions to Ohio’s economy from presenters was 73 percent greater than the national share; in Georgia it was 31 percent greater.
ACPSA estimates restrict presenting’s value to the share derived from the performing arts. However, not all of the industry’s revenue stems from showcasing the arts—about 20 percent is from admissions to sporting events and other entertainments, according to the ACPSA.
That said, other national data sources also reveal interesting traits about presenters.
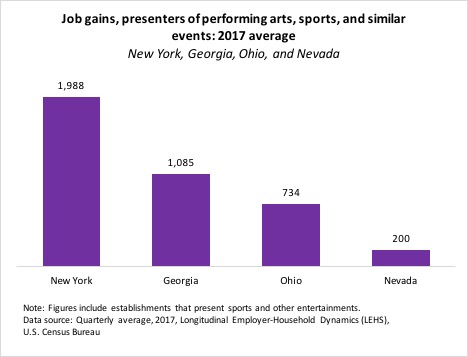
For example, considering the states where performing arts presenters contribute a lot of economic value, data from the U.S. Census Bureau’s Longitudinal Employer-Household Dynamics (LEHD) program show job gains for each quarter in 2017.
Although Nevada has far and away the greatest economic concentration of performing arts presenters, the industry gained fewer jobs than New York, Georgia, and Ohio did. In 2017, Nevada gained a quarterly average of just 200 jobs in performing arts presenting establishments. During the same time period, New York, Georgia, and Ohio gained an average of roughly 700-2000 jobs in the industry.
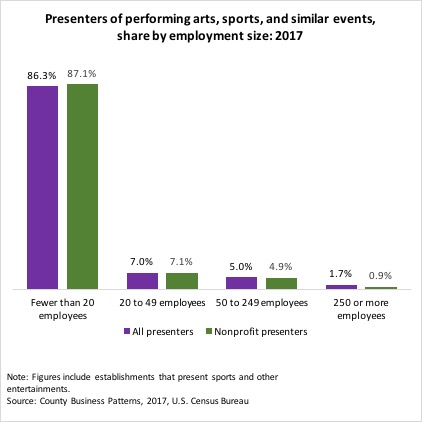
Another Census data source, County Business Patterns (CBP), affords a glimpse into the job characteristics of the performing arts presenters industry. For example, CBP show that 37 percent of presenting establishments are nonprofit organizations. Further, nonprofit presenters account for one-quarter of the industry’s annual payroll (a reasonable proxy for the industry’s value added).
A large majority of all presenters, including nonprofits, employ fewer than 20 workers, though nonprofit presenters are less likely to be large employers, staffing at least 250 workers.
Together, these multiple data sources point to the sizeable and growing economic contribution of performing arts presenters as an industry. As it happens, we first reported this trend in a 2016 “Taking Note” blog post titled (aptly) “The Outperforming Performing Arts Sector.”
Stay Connected to the National Endowment for the Arts