Taking Note: Monitoring the Role of Freelancers and Small Businesses in the Arts Economy—and Early Signs of COVID-19 Impact

According to federal statistics, more than a third of all artists are self-employed. We also know that many key arts industries consist mainly of small businesses. For example, more than 85 percent of performing arts companies and virtually all design firms employ fewer than 20 workers.
The COVID-19 pandemic has put American artists and arts organizations in the crosshairs of a severe economic contraction. Freelance arts workers and small arts businesses are among the most vulnerable. Especially now, it can be useful to quantify the role of self-employed workers and small businesses in the overall arts economy.
Just take a dozen key arts industries and see how much they rely on freelance arts workers and small businesses. In 2017 (the most recent year for which data are available), arts and cultural industries added a total of $877.8 billion to U.S. GDP. Of that amount, the majority (65 percent) came from 12 industries: the performing arts; independent artists, writers, and performers; performing arts presenters; motion picture and video; sound recording; publishing; broadcasting; web publishing and streaming; architecture; landscape architecture; specialized design; and photography.
These 12 arts industries contributed $575 billion to the nation’s GDP. Nearly 20 percent ($109 billion) of this amount came from self-employed workers and small businesses alone, based on the Arts Endowment’s calculations, using a variety of federal data sources.
For many individual industries, that percentage is much higher. It stands to reason that freelancers and small businesses account for nearly all the GDP (over $38 billion) produced by an industry made entirely of “independent writers, artists, and performers.” However, freelancers and small businesses also contribute 70 percent or greater of the economic value resulting from the following arts industries: photography; specialized design; and landscape architecture.
Freelancers and small businesses also make up 41 percent (or $8.9 billion) of the GDP from architecture related to cultural facilities, 38 percent (or $5.3 billion) of GDP from performing arts companies, 27 percent (or $4.1 billion) of GDP from performing arts presenters, and 18 percent of GDP from the film/video and sound recording industries, respectively. In the case of film/video, that percent translates to $13.5 billion in GDP. (Click to see table.)
*****
Given the outsized economic footprint of arts freelancers, what may we conclude about their employment status in the wake of COVID-19? At this time, federal data on the question are still forthcoming. In April, a group of small and midsized foundations launched an “Artist Relief” fund to support grants of $5,000 each to artists “facing dire financial emergencies” because of the pandemic. As part of the initiative, Americans for the Arts (AFTA) has designed and co-launched a “COVID-19 Impact Survey for Artists and Creative Workers.” Based on 15,700 survey responses to date, AFTA reports that 95 percent of artists and creative workers have experienced losses to their income, 61 percent claim a “drastic decrease” in creative work that can generate income, and 66 percent are unable to access supplies, space, or resources (including people) necessary for such work.
Federal statistics, meanwhile, are giving us lagged glimpses of the early financial toll of COVID-19 for arts industries. These data, covering unemployment conditions and consumer spending, are available from the U.S. Department of Labor (DoL), the Bureau of Labor Statistics (BLS), and the Bureau of Economic Analysis (BEA).
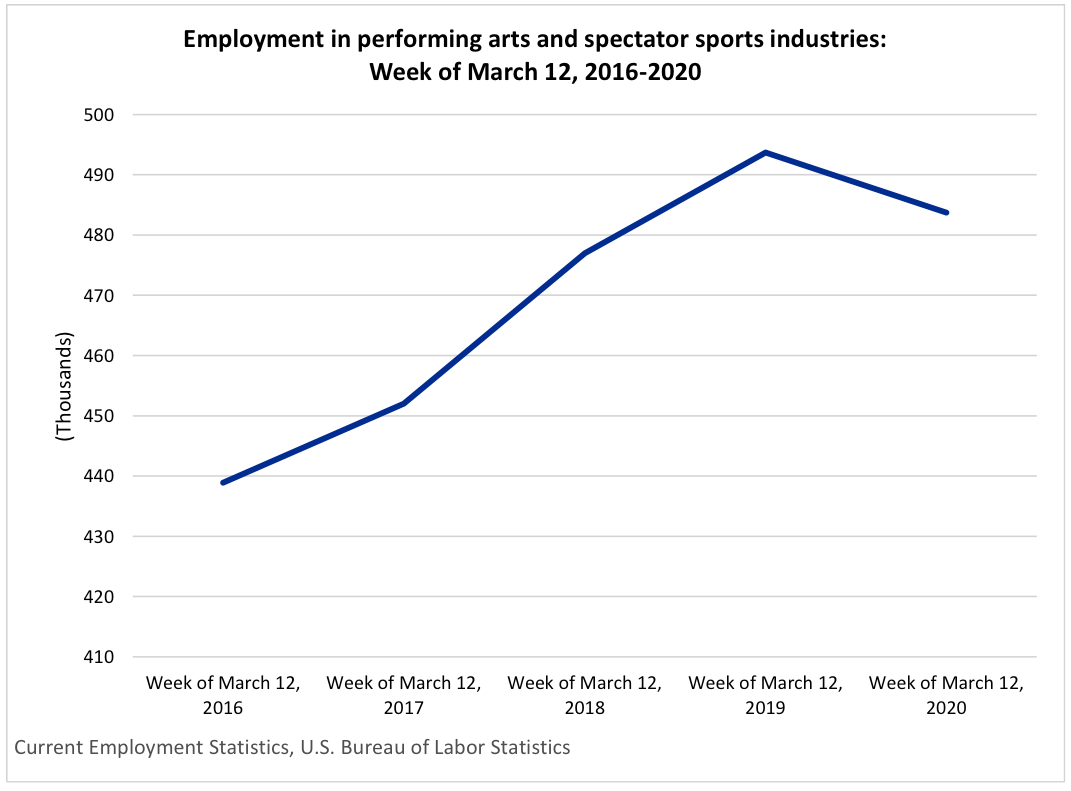
Referencing the week of March 12 (the very week Broadway theaters closed their doors), BLS’ Current Employment Statistics data show that employment in the performing arts and spectator sports industries fell 2 percent, compared with March 2019 employment. At the same time, employment in all private industries increased 1 percent.

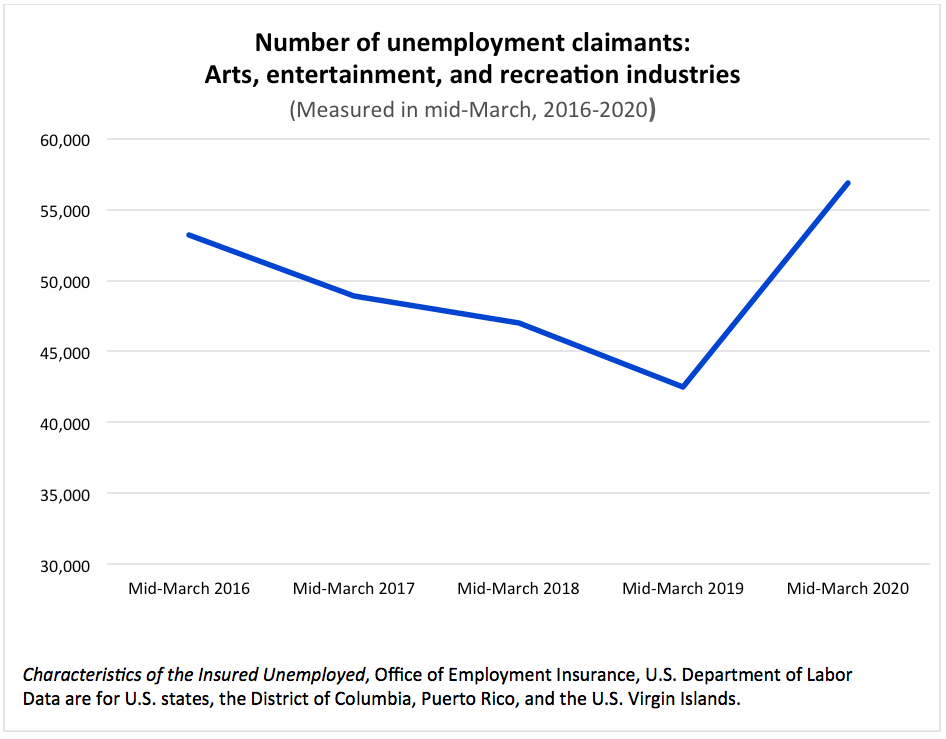
DoL reports that after falling every year since 2011, unemployment claims for workers in the arts and entertainment sector jumped 34 percent from mid-March 2019 to mid-March 2020. This figure is nearly three times the growth rate of unemployment claims for all U.S. industries as a whole (+12 percent over the same period).
So far, states with relatively high growth in arts and entertainment industry unemployment claims include Georgia, where the number grew by 41 percent, California (+39 percent), Minnesota (+37 percent), Massachusetts (+29 percent), and Tennessee (+23 percent).

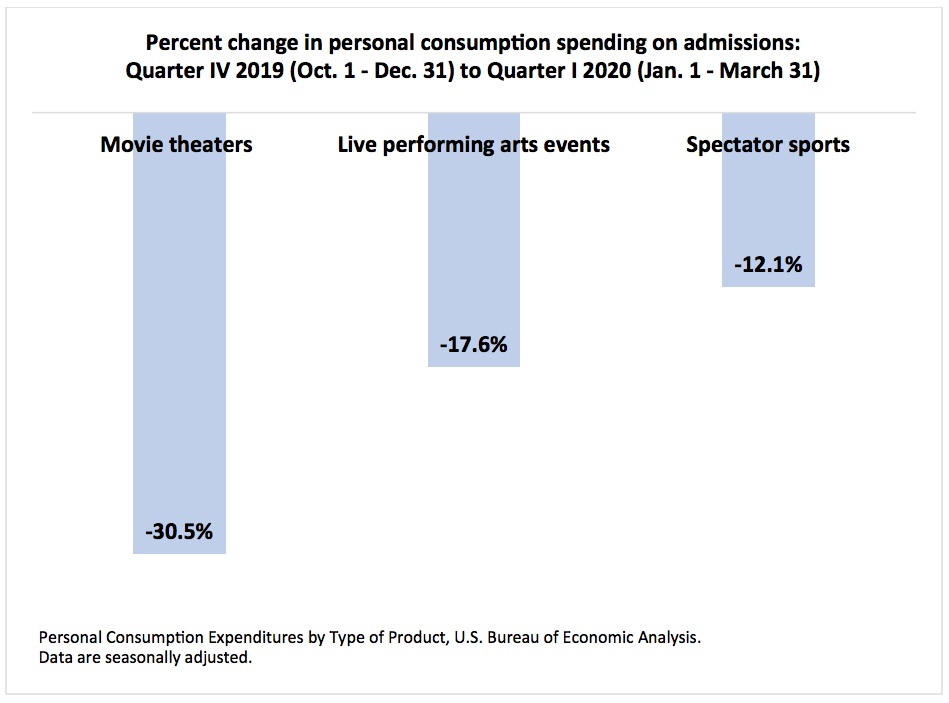
For indicators of consumer spending on the arts—specifically on admissions to “arts and entertainment” events—we turn to data from the BEA. According to seasonally adjusted estimates, consumer outlays on performing arts event tickets dropped more than 17 percent between the final quarter of 2019 (October-December) and the first quarter of 2020 (January-March).

Government statistics that include April 2020 activity (a period more fully reflecting the impact of the pandemic) will be issued later this month and throughout the summer. The BLS’s Current Employment Statistics for performing arts companies (independent of sports) are due on May 8, while quarterly data on artist employment from the Current Population Survey are slated for July release.


