Background
Dataset
Arts and Cultural Production Satellite Account (ACPSA).
Periodicity
Launched in 2013, the ACPSA is intended as an annual product.
Source/Sponsor
Partnership between the NEA’s Office of Research & Analysis and the U.S. Bureau of Economic Analysis.
Research Topic
Arts and the GDP
Notable Features
- Inflation-adjusted estimates of the arts and culture’s real contribution to the U.S. economy
- Value added
- Gross output
- Full time-series spanning 1998-2014
- Employment and compensation by arts and cultural industries
- Supply and consumption of arts and cultural goods and services, including imports and exports
- Gross output price indexes for arts and cultural commodities
Revisions to ACPSA
The account provides both nominal and “real” estimates of arts and cultural production measured in chained 2009 dollars.
Overview
Between 2012 and 2014, the average annual growth rate in the real (i.e., inflation-adjusted) value added by arts and cultural production was 1.4 percent, somewhat greater than the 1.3 percent growth rate generated by the total U.S. economy during that period.
Moreover, between 2012 and 2014, real value added by arts and cultural production grew by $28.8 billion or 4.4 percent.
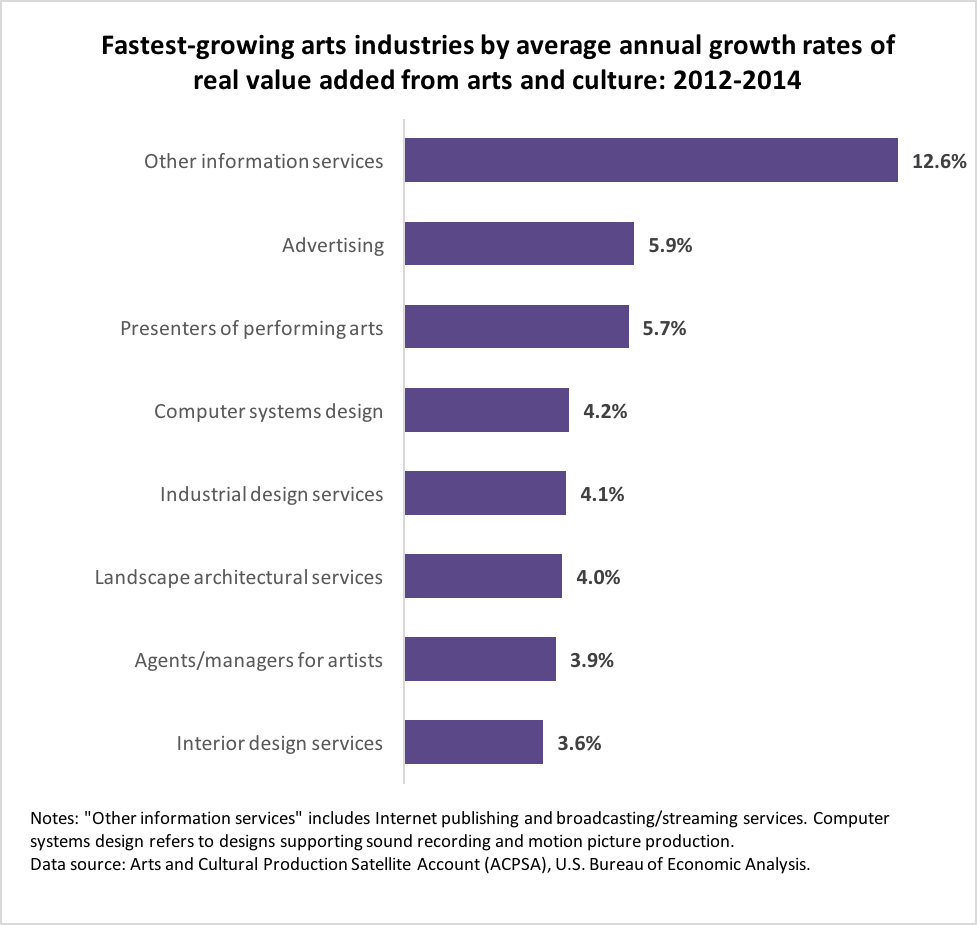
Fast-growing industries producing arts and cultural services include: “other information services,” an industry that includes online publishing and broadcasting; advertising services; presenters of performing arts; and industrial design services.