Sample Findings
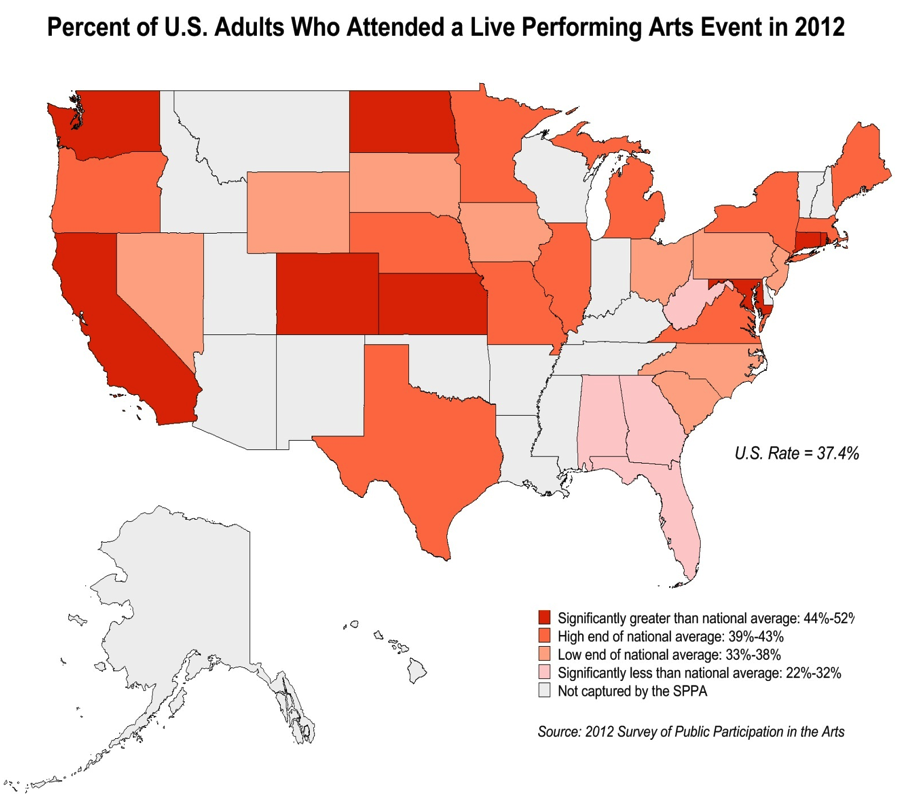
Performing Arts Attendance by State
The SPPA reliably captures estimates for the following 32 states: AL; CA; CO; CT; FL; GA; IL; IA; KS; ME; MD; MA; MI; MS; MO; NE; NV; NJ; NY; NC; ND; OH; OR; PA; RI; SC; SD; TX; VA; WA; WV; WY.
For the purpose of this analysis, performing arts attendance involves going to one or more of the following types of event: classical music, Latin or Spanish/salsa music, or jazz performances; opera, musical theater, or non-musical plays; ballet or other dance performances; or outdoor performing arts festivals.
Performing arts attendance rates are comparatively high in eight states: Colorado, North Dakota, Maryland, Washington, Kansas, Rhode Island, Connecticut, and California. Among the 32 states captured by the 2012 SPPA, these exhibit performing-arts attendance rates significantly higher than the U.S. national rate of 37 percent.
In Colorado, North Dakota, and Maryland, for example, approximately 50 percent of adults went to a performing arts event in the 12 months ending in July 2012; in Washington, Kansas, and Rhode Island, 45 percent attended the performing arts.
At the other end of the scale are Georgia and Alabama, where performing arts attendance is significantly lower than the national rate. In 2012, attendance rates in those states were 26 percent and 22 percent, respectively.
Still, sizable numbers of residents in both states attend the performing arts. In Alabama, 779,000 adults went to a performing arts event in the 12-month-period captured by the 2012 SPPA. In Georgia, nearly 2 million adults attended.
Two-Thirds of States Show Average Rates of Performing Arts Attendance
While above- or below-average attendance is found in only a handful of states, the 2012 SPPA shows that attendance at live performing arts events approximates the U.S. national rate in 21 of the 32 states captured by the survey.
In states such as Nebraska, Oregon, Maine, and Michigan, performing arts attendance ranges from 41 to 43 percent—rating on the high end of the U.S. average, after accounting for sampling methodology.
Still average, but somewhat lower, are performing arts attendance rates in states such as Pennsylvania and New Jersey, where an estimated 35 percent of adults went to a performing arts event between July 2011 and July 2012.
Classical, Latin, and Jazz Music Attendance
High Concert-Going Rates in Colorado, Washington, Nebraska, and California
Contributing to high performing arts attendance in Colorado is the state's classical music concert-going rate. In the 12-month-period tracked by the 2012 SPPA, 21 percent of Colorado's adults attended a classical music performance.
That rate is significantly higher than the national classical attendance rate (8.8 percent), and higher than rates reported by adults in most other states, including Illinois, New York, and Texas, where the share of adults attending classical concerts approximates the national rate, particularly after accounting for SPPA sampling methodology.
The classical music attendance rate in Washington, 13.9 percent, is also significantly higher than the national rate.
Nebraska's jazz attendance rate is among the highest in the country, and significantly higher than the national rate. The 2012 SPPA reports that 15.7 percent of adults in Nebraska attend jazz music performances. That rate is nearly double the national jazz attendance rate of 8.1 percent.
California and New York are the only two states with Latin music attendance rates significantly higher than the overall U.S. share attending. In the 12 months ending in July 2012, roughly 9 percent of adults in both states went to Latin or Spanish or salsa music performances.
Although not technically greater than the national rate (after factoring in the SPPA survey design), Latin music concerts are also comparatively popular in Florida, where 7.3 percent of adults are Latin concert-goers.
| Percent of U.S. Adults Who Attended a Latin Music Performance in 2012 | ||||
| California, New York, and Florida | ||||
| Adult population (in millions) |
Latin music attendance rate | Lower boundary1 | Upper boundary1 | |
| U.S. | 235.0 | 5.1% | 4.7% | 5.5% |
| California | 28.2 | 9.5% | 7.7% | 11.5% |
| New York | 15.0 | 8.7% | 6.6% | 11.4% |
| Florida | 15.0 | 7.3% | 5.5% | 9.6% |
| 1 Lower and upper boundaries based on 90 percent confidence intervals. | ||||
Musical Theater, Opera, and Non-Musical Play Attendance
High Rates of Theatrical Attendance in the Plains States
In attendance at musical plays or opera, six states significantly surpass the U.S. estimate of 16 percent: North Dakota, Minnesota, Connecticut, Nebraska, Colorado, and Washington. In North Dakota and Minnesota, for example, nearly one in four adults attends musical plays or opera.
Minnesota also ranks highly in non-musical play attendance, as does Colorado, Oregon, Rhode Island, and Maryland. In all five states, the share of adults attending non-musical plays is 13-15 percent—well above the attendance rate of 8.8 percent for that category.
Below average, however, are the play-going rates among residents of Florida, Ohio, Georgia, and West Virginia—each with a non-musical play attendance rate of 4-5 percent.
As discussed earlier, such rates, though low when compared with the national rate, nonetheless amount to large numbers of attendees. For example, 758,000 of Florida's residents went to a play, as did 378,000 of Ohio's.
Attendance at Dance Performances
Colorado Is Only State Surpassing U.S. Dance Attendance Rate
After accounting for the SPPA sampling design, only Colorado ranks above the national rate of dance attendance. In the 12 months ending in July 2012, 13.2 percent of the state's adults attended a ballet or "other dance" performance such as modern dance or tap. That rate was more than 5 percentage points higher than the U.S. rate of 7.4 percent.
Although not technically greater than the U.S. rate (after considering the survey's margin of error), Washington, Rhode Island, and New York nevertheless report high attendance rates for dance—roughly 10 percent of adults in each of these states go to such performances.
| Percent of U.S. Adults Who Attended a Dance Performance in 2012 | ||||
| (Ballet or Other Dance) | ||||
| Colorado, Washington, Rhode Island, and New York | ||||
| Adult population (in millions) | Dance attendance rate | Lower boundary1 | Upper boundary1 | |
| U.S. | 235.0 | 7.4% | 7.0% | 7.9% |
| Colorado | 3.8 | 13.2% | 10.1% | 17.0% |
| Washington | 5.2 | 10.5% | 7.4% | 14.7% |
| Rhode Island | 0.8 | 10.0% | 6.8% | 14.5% |
| New York | 15.0 | 9.5% | 7.5% | 12.0% |
| 1 Lower and upper boundaries based on 90 percent confidence intervals. | ||||
Visual Arts Attendance by State
For the purpose of this analysis, visual arts attendance involves visiting one or more of the following: museums or art galleries; visual arts festivals or craft fairs; and visiting historic parks or monuments or touring buildings or neighborhoods for their historical or design value.
State Patterns in Visual Arts Attendance Mirror Those in the Performing Arts
The 2012 SPPA shows that state-level patterns in attendance at visual arts venues are similar to those found in performing arts attendance—i.e., states with comparatively high visual arts participation are often states with high performing arts attendance.
For example, states exceeding by 10 to 20 percentage points the national attendance rate for the performing arts include: Colorado, Oregon, Maryland, Washington, and Minnesota—states also ranking highly in concert, play, and dance attendance.
Similarly, the share of adults visiting visual arts venues was low in states such as Georgia, Florida, and Alabama, where performing arts attendance rates also tend to be lower.
Visiting Art Museums and Art Galleries
Art Museum Attendance High in Oregon, Colorado, Washington, Minnesota, Maryland, and California
In Oregon, Colorado, and Washington, the share of adults visiting art museums or galleries is 34-36 percent. In Minnesota, Maryland, and California, the rate is roughly 28 percent. In each of these six states, art museum attendance is significantly greater than the national rate of 21 percent, after considering the SPPA sample design.
Alternatively, museum attendance rates in South Dakota, West Virginia, Alabama, and Georgia, which range from 8 percent (Alabama and Georgia) to 14 percent (South Dakota), are significantly below the national rate.
However, as with performing arts attendance, these lower rates still reflect sizable numbers of museum visitors—547,000 (Georgia); 298,000 (Alabama); and 146,000 (West Virginia).
| Percent of U.S. Adults Who Visited an Art Museum or Art Gallery in 2012 | ||||
| States with Attendance Rates Significantly Higher Than the U.S. Rate | ||||
| Adult population (in millions) |
Art museum or art gallery attendance rate | Lower boundary1 | Upper boundary1 | |
| U.S. | 235.0 | 21.0% | 20.3% | 21.8% |
| Oregon | 3.0 | 36.5% | 28.7% | 45.1% |
| Colorado | 3.8 | 35.2% | 30.3% | 40.4% |
| Washington | 5.2 | 33.9% | 28.1% | 40.2% |
| Minnesota | 4.0 | 28.3% | 23.8% | 33.2% |
| Maryland | 4.4 | 28.0% | 22.8% | 33.9% |
| California | 28.2 | 26.7% | 23.6% | 30.0% |
| 1 Lower and upper boundaries based on 90 percent confidence intervals. | ||||
Attending Visual Arts Festivals or Craft Fairs
In addition to exhibiting high rates of art museum attendance, Colorado, Oregon, and Maryland also show above-average attendance at visual arts festivals and craft fairs. For instance, 37 percent of Colorado's residents attend, as do 34 percent of Oregon's adults. In Maryland, approximately 30 percent attend visual arts festivals or craft fairs.
Visual arts festivals and fairs are also popular among residents of North Dakota (33 percent), and Rhode Island and Michigan (29 percent). In each of these states, attendance is significantly higher than the U.S. attendance rate of 22.4 percent.
Visiting Historic Parks or Monuments or Touring Buildings or Neighborhoods for Their Historical or Design Value
A similar pattern is also found in the percentage of adults visiting historic parks or monuments or touring buildings or neighborhoods for their historical or design value. Rates significantly higher than the national rate of 24 percent are found in: Maryland (37 percent); Colorado (36 percent); Oregon (35 percent); and Minnesota and North Dakota (33 percent).
Literary Reading by State
More than 60 Percent of Adults Residing in Washington State Read Literature
Nearly 63 percent of adults residing in Washington read literature (poetry, plays, novels, or short stories). That rate is almost 16 percentage points greater than the national rate of 47 percent.
Literary reading rates are also significantly greater than the national average in Rhode Island, Colorado, and Connecticut (roughly 56 percent in each state), and in Maryland (53 percent).
Literary reading rates are significantly below the national rate in Georgia (39 percent), Nevada (37 percent), West Virginia (36 percent), and Alabama (34 percent).
Arts Creation and Other Pastimes by State
Twenty Percent of Wyoming's Residents Craft Leather, Metal, or Wood
In addition to tracking attendance at performing and visual arts events, the SPPA also measures the number of adults who create art or participate in other leisure activities.
For example, more than one-quarter of Oregon's adults take photographs as an artistic activity. This rate is more than 15 percentage points greater than the U.S. estimate of 12 percent. Oregon, along with Maine, also ranks highly in share of adults doing quilting, knitting, or other sewing or needle work. More than 20 percent of residents in both states report engaging in this activity.
Among all U.S. adults, 8.2 percent do woodwork, or craft leather or metal. Among Wyoming's residents, however, that rate is 22 percent—nearly 14 percentage points higher than the national average.
| Percent of U.S. Adults Who Did Leatherwork, Metalwork, or Woodwork: 2012 | ||||
| States with Participation Rates Significantly Higher than the U.S. Rate | ||||
| Adult population (in millions) |
Did leatherwork, metalwork, or woodwork | Lower boundary1 | Upper boundary1 | |
| U.S. | 235.0 | 8.2% | 7.7% | 8.7% |
| Wyoming | 0.4 | 22.0% | 17.7% | 27.0% |
| Kansas | 2.1 | 16.8% | 11.8% | 23.3% |
| Maine | 1.1 | 16.6% | 12.7% | 21.4% |
| Oregon | 3.0 | 15.0% | 11.0% | 20.2% |
| Iowa | 2.3 | 14.1% | 10.2% | 19.1% |
| Connecticut | 2.8 | 13.3% | 9.2% | 18.9% |
| South Dakota | 0.6 | 12.8% | 9.6% | 17.0% |
| 1 Lower and upper boundaries based on 90 percent confidence intervals. | ||||
One in four U.S. adults report doing outdoor activities such as camping, hiking, or canoeing. But among Oregon's residents, 60 percent participate in these activities.
Additionally, 17 percent of U.S. adults report that they hunt or fish. However, 40 percent of Wyoming's residents and of North Dakota's go hunting or fishing.
At the other end of this scale are New Jersey, New York, and Maryland——only 9 to 10 percent of residents in these states hunt or fish.
Venues for Arts Attendance by State
Attending Arts Events in Places of Worship is Popular in Nebraska, Minnesota, North Carolina, and Alabama
State-level diversity is also exhibited in the venues where people attend a performing or visual art event. For instance, 12.2 percent of U.S. adults report attending in bars, restaurants, nightclubs, or coffee shops. However, this rate is far exceeded by residents of Nebraska, where 25 percent attend performing or visual arts events in these venues. This rate is also high among residents of Colorado and Washington--roughly 20 percent in both states.
Along with adults living in Minnesota and North Carolina, residents of Nebraska also report above-average performing or visual arts attendance at places of worship. In 2012, rates for all three states were 16-19 percent—roughly 7-9 percentage points higher than the national rate.
Finally, though not significantly greater than the national rate (after accounting for the SPPA's margin of error), arts attendance at churches, synagogues, and other places of worship was high among residents of Alabama (16 percent).
Arts Attendance by Metropolitan Area
The 2012 SPPA captured arts participation among adults living in 11 metropolitan areas: Boston-Worcester-Manchester, MA-NH; Chicago-Naperville-Michigan City, IL-IN; Dallas-Fort Worth, TX; Denver-Aurora-Boulder, CO; Detroit-Warren-Flint, MI; Los Angeles-Long Beach-Riverside, CA; Miami-Fort Lauderdale-Miami Beach, FL; New York-Newark-Bridgeport, NY-NJ-CT-PA; Philadelphia-Camden-Vineland, PA-NJ-DE-MD; San Jose-Francisco-Oakland, CA; and Washington-Baltimore-Northern Virginia, DC-MD-VA-WV.)1
High Performing Arts and Visual Arts Attendance in the Denver, San Francisco, and Washington-Baltimore Areas
Performing Arts Attendance
After accounting for sampling error, many of the metro areas captured by the SPPA report performing arts attendance rates comparable to the national rate (about 37 percent). For example, roughly 40 percent of adults living in the Dallas, Chicago, New York, and Philadelphia areas went to a performing arts event in the 12 months ending in July 2012.
Exceptions are found in greater Denver, San Francisco, and Washington-Baltimore. In all three metropolitan areas, performing arts attendance ranged from 50 percent to 60 percent—or 10 to 20 percentage points higher than the U.S. rate.
High performing-arts attendance rates in these areas reflect, in part, correspondingly high concert and play-going rates. In the San Francisco area, for example, the percentage of adults attending a musical play or opera is 26 percent—10 percentage points higher than the U.S. rate.
Among Washington-Baltimore residents, the jazz attendance rate is nearly 15 percent, 7 percentage points greater than the national average. (Jazz attendance rates are also 15 percent among residents of the greater Detroit area.)
Notably, the percentage of Denver-area adults attending classical concerts is 25 percent—16 percentage points higher than the U.S. rate of 9 percent.
Attendance at Visual Arts Events
The same three metros also score highly in attendance at visual arts events. In the 12 months ending in July 2012, for example, nearly 35 percent of adults living in the San Francisco area visited an art museum—a rate well above the national rate of 21 percent. And 35 percent of Denver- area residents attended a visual arts festival or crafts fair. Denver's rate of attending these events was more than 12 percentage points greater than the U.S. average of 22 percent.
Given the Washington area's abundance of historic parks and monuments, it is perhaps not surprising that DC's residents visit these sites at high rates—nearly 42 percent (18 percentage points above average) in the 12 months covered by the 2012 SPPA.
Why Some States Exhibit Higher Rates of Attendance
Exposure to the Arts in Childhood is Linked to Arts Participation as Adults
The pattern evident in state-level attendance at arts events—where residents of states such as Colorado and Washington report high attendance rates, while others, such as residents of Alabama and West Virginia, report lower attendance—is likely related to access to the arts in childhood, as well as factors such as education and socio-economic conditions.
Testing this hypothesis, we used Pearson correlation coefficients (symbolized by "r") to quantify how strongly variables are related to each other. The coefficient ranges between 0 and 100 percent, and can be either positive or negative.2
For example, the correlation coefficient between state-level performing arts attendance rates and the share of each state's residents who hold a bachelor's degree or higher level of education is 53.8 percent; between performing arts attendance and poverty, the coefficient is -53.4 percent—i.e., there is a negative relationship between performing arts attendance and the incidence of poverty.
Our correlation analysis suggests, however, that arts attendance may be even more strongly related to childhood arts exposure. For example, the coefficient between performing arts attendance rates as adults and the share of each state's residents who took music or dance classes in childhood is an impressive 61.8 percent.
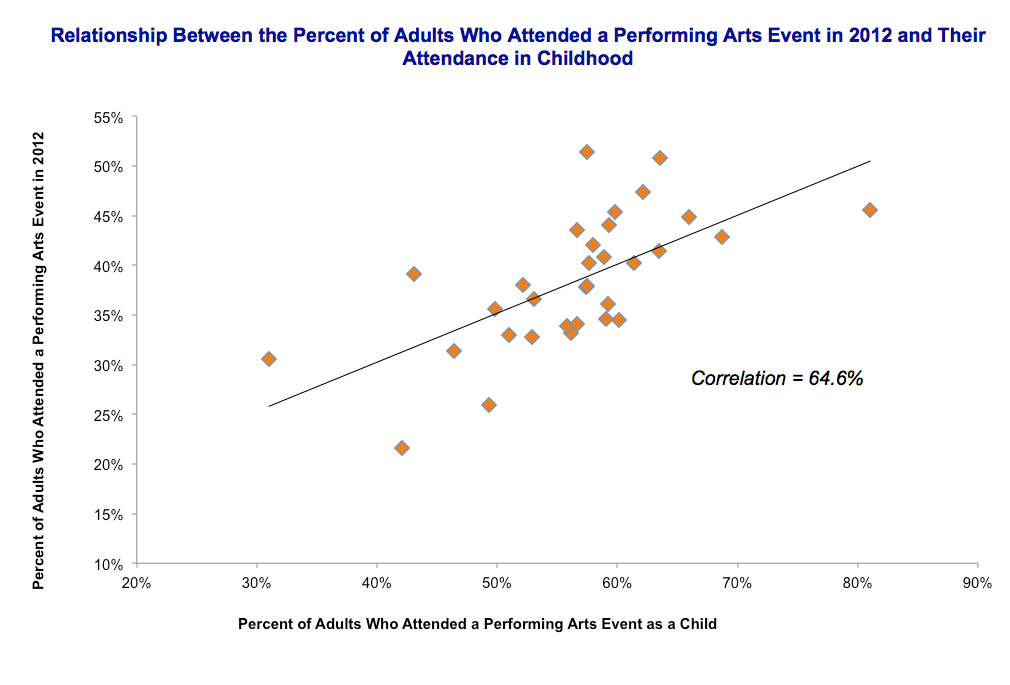
The 2012 SPPA was the first to ask adult respondents if they had attended a live music, theater, or dance performance when they were children (under 18), or if they had visited an art museum in childhood. Their responses, analysis suggests, are strongly related to attendance as adults—the correlation coefficient between performing arts attendance in adulthood and in childhood is 64.6 percent; between visiting art museums as adults and as children, the coefficient is even greater—73.3 percent.
Moreover, the odds of attending performances as adults are more than 3 times greater for those who attended a live music, theater, or dance performance in childhood, relative to those who did not.3 This is true even after controlling for educational attainment, gender, age, and whether the respondent lived in a metropolitan area or had children under 18.
Similarly, exposure to art museums in childhood is a strong predictor of museum attendance in adulthood. Controlling for the same factors (e.g., adult educational attainment, gender, age, etc.), respondents who visited an art museum as children are nearly 5 times as likely to visit art museums as adults, relative to those who did not visit art museums as children.
| Relationship Between Performing Arts Attendance and Childhood Exposure to the Arts, Childhood Arts Learning, Higher Education, and Poverty | |
| Relationship with performing arts attendance as an adult (correlation coefficient) | |
| Attended live music, theater, or dance performances as a child | 64.6% |
| Took music or dance classes as a child | 61.8% |
| Hold a bachelor's degree or higher level of education1 | 53.8% |
| Live below poverty level | -54.3% |
| 1 Age 25 and older | |
At the U.S. level, for instance, 38 percent of adults took music or dance lessons as a child; 55.6 percent attended a performing arts event as a child. However, among Colorado's adults, who consistently rank highly in performing arts attendance, the shares who took classes as children or went to events in childhood are well above the national average—45.9 percent and 63.5 percent, respectively.
Alternatively, adult performing arts attendance rates in Alabama tend to be lower, and the share of Alabama's adult residents who took childhood arts classes or attended a performing arts event as a child are also comparatively low—25.6 percent and 42.1 percent, respectively.
Among all U.S. adults, 21 percent visited an art museum or gallery in 2012. But in Washington State, that rate was 33.9 percent—among the highest museum-attendance rates in the country.
Likely contributing to high art museum attendance in Washington is the share of the state's adults who visited an art museum as children—75 percent, a rate more than 20 percentage points greater than the U.S. average of 54.3 percent. What's more, 18.2 percent of Washington's adults took an art appreciation or art history course as children. At the U.S. level, that rate was more than 9 percentage points lower—8.8 percent.
Below-average art museum attendance is reported among adults residing in West Virginia (10.4 percent). Also below average were the shares of West Virginia's adults who reported visiting an art museum as children (38.3 percent) or taking an art appreciation/art history class in childhood (6.7 percent).
| Odds Ratios of Visiting and Art Museum or Gallery as an Adult | |
| Odds ratios: | |
| Characteristics: | |
| Visited an art museum as a child | 4.8 |
| Hold a bachelor's degree or higher level of education | 4.0 |
| Female | 1.4 |
| Live in a metropolitan area | 1.3 |
| Have children under age 18 | 0.7 |
| Age | 1.0 |
| Note: All odds ratios reported are significant at 95 percent confidence, except age. Source: 2012 Survey of Public Participation in the Arts |
|
Access to Performing Arts Organizations and Art Museums
In some states, arts attendance appears to be related to the number of arts organizations providing performing arts events and art exhibits. For example, the performing arts attendance rate among California's residents, 42.2 percent, is significantly greater than the U.S. rate of 37.4 percent. California is also home to an above-average number of performing arts organizations—3.7 per 100,000 population, versus 2.8 per capita at the U.S. level.
At the other end of the scale is Alabama, which ranks among the lowest in performing arts attendance, and is home to only 1.2 performing arts organizations, per capita.
However, among many other states, the link between performing arts attendance and the number of performing arts organizations is weak. Performing arts attendance in New York State, for example, is not significantly greater than the national average. Yet New York State is home to more than seven performing arts organizations, per capita.
Moreover, states such as Colorado and Oregon, which rank highly in performing arts attendance, are home to only a slightly greater than average number of performing arts organizations—roughly 3 per 100,000 population.
The Pearson correlation coefficient between state-level performing arts attendance and state tallies of performing arts organizations, per capita, was small—27 percent—and it was statistically insignificant.
Further investigation is needed to more fully understand the link between access to arts organizations and attendance. An analysis done at a more detailed geography, say metropolitan statistical areas, may reveal a stronger link between the number of arts organizations in a given area and that area's arts participation.
Although the SPPA does not capture enough detailed metropolitan area data to reliably test this link, the survey does reveal that adults living in metropolitan areas are 20-30 percent more likely to attend performing arts events or visit art museums than those living in rural, non-metropolitan areas.
____________________
1 A metropolitan statistical area contains a core urban area of 50,000 or more population. Each metro area consists of one or more counties and includes the counties containing the core urban area, as well as adjacent counties that have a high degree of social and economic integration with the urban core.
2 The Pearson correlation coefficient is a measure of the strength of a linear association between two continuous variables. The Pearson correlation coefficient does not indicate how or why they are related.
3 Unlike the correlation coefficients presented in this summary, which are based on state-level results, the odds ratios were based on a national-level logit model analysis.