Why It is Difficult to Rank State Participation Levels
For each estimate provided in the tables to this Profile, a lower and upper boundary are also reported. Calculated as 90 percent confidence intervals, the boundaries show the range of the estimate after considering the SPPA's sample design.
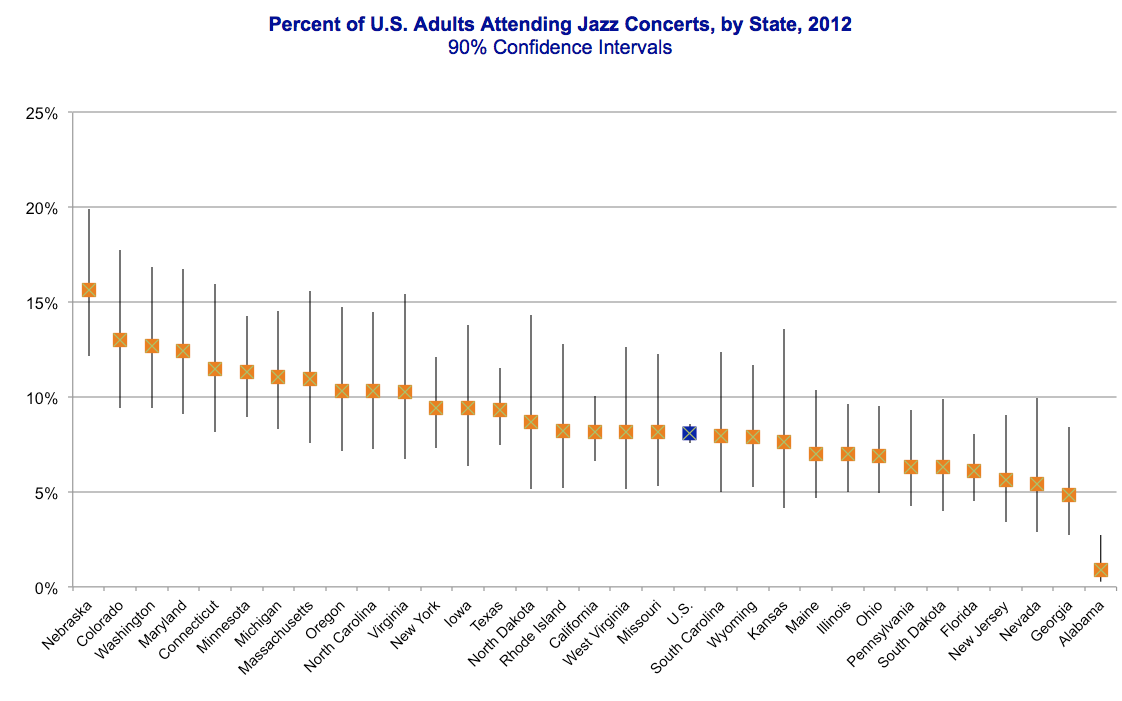
For example, the 2012 jazz attendance rate for Connecticut is 11.5 percent, a rate greater than the figure reported for North Carolina, which is 10.3 percent. However, the confidence interval for Connecticut's jazz attendance rate ranges from a high of 16 percent to a low of 8.1 percent. This interval crosses the range estimated for North Carolina, which spans 14.5 percent to 7.3 percent.
Because the intervals for the two states overlap, we cannot necessarily conclude that Connecticut's jazz attendance rate is significantly greater than the rate for North Carolina.
The graph below shows that the confidence intervals associated with jazz attendance overlap among many of the 32 states captured by the 2012 SPPA. However, jazz attendance among residents of Nebraska, Colorado, Washington, Maryland, and Massachusetts is significantly greater than the national rate, and greater than jazz attendance among residents of Florida, New Jersey, Georgia, and Alabama.
Calculating Confidence Intervals for SPPA Estimates
As a supplement to the Current Population Survey, the SPPA is a complex survey that employs "clustering,' a sampling technique in which the population is divided into groups, or clusters, and a sample of these groups is selected.
The 90 percent confidence intervals reported in this Profile were generated by adding (upper limit) or subtracting (lower limit) 1.645 times the estimated standard errors. The standard errors, in turn, were estimated using a balanced repeated replication (brr) method, which incorporated the replication weights that accompany the 2012 SPPA. Further, the brr method applied a "Fay" adjustment of 0.50 percent.